Issue 41: Rationally Irrational
May 2023
Sparked by Silicon Valley Bank's failure on March 10, we have witnessed unprecedented dispersion in the returns of Mega Cap Tech and the broader markets over the past two months. In isolation, this phenomenon is understandable. These companies are massive, economically resilient, and possess strong balance sheets. However, in the long run, performance is determined by fundamentals rather than multiple expansion. The previous instance when Apple held such a large percentage of the market resulted in a period of robust performance for Small Cap Stocks. As the saying goes, "Trees can't grow to the sky," and this applies even to Apple.
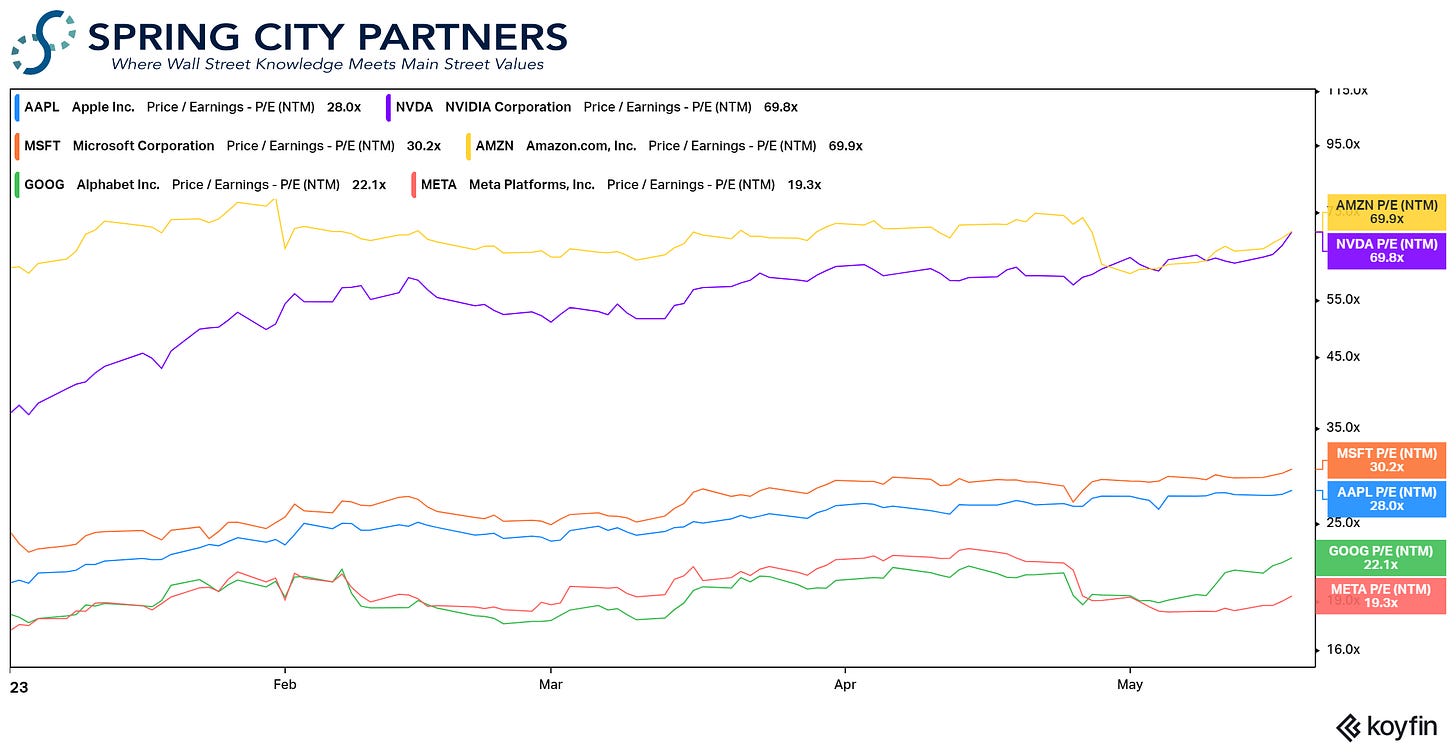
The year-to-date return of the S&P 500 has been primarily driven by the price increase of seven mega cap tech companies. Apple, Microsoft, Amazon, Nvidia, Alphabet (Google), Meta (Facebook), and Tesla have contributed ~8.7% out of the total 10.0% return of the S&P 500. Microsoft is the weakest performer among this group, with a meager 33% year-to-date increase. These businesses collectively represent ~25.9% of the S&P 500, implying that the remaining 493 stocks have only seen a 1-2% increase.
Is it merely coincidental that the returns of these stocks significantly changed on March 10, following the collapse of Silicon Valley Bank? As mentioned earlier, these companies possess qualities that make them appear safe during uncertain times. However, the swift and sizable movement over a short period allows little room for future appreciation unless there is a major change in the fundamentals. For example, Microsoft's price-to-earnings (P/E) ratio started at ~22x in 2023 and has now expanded to ~30.0x, a 36% increase resulting from investors willing to pay a higher multiple for Microsoft's earnings.
The current size and performance of Apple, could be a sign that things are about to change in the market. We saw a similar dynamic over the Summer of 2020. The chart below compares the size of Apple to the Russell 2000, which represents ~2,000 small-cap companies in the United States with an average market capitalization of $2.9 billion. Today marks the second time in history that Apple's value has exceeded that of the Russell 2000. If you have $2.5 trillion lying around, you can buy Apple or ~2,000 companies that makeup the Russell 2000.
If we revisit the previous occurrence when Apple's value surpassed that of the Russell 2000, it signified a pivotal moment in the market. While history doesn't repeat, it does rhyme. In the summer of 2020, the world was grappling with the uncertainties brought about by the COVID pandemic. Now, fast-forward to the present, and we find ourselves facing uncertainties related to the economy, housing, interest rates, China, Russia, the debt ceiling, and more. Though the fears may differ, the market reaction seems reminiscent.
More importantly, over the subsequent twelve months, the Russell 2000 outperformed Apple by approximately 35%, representing a significant reversal from the previous trend of underperformance.
As mentioned earlier, the market often behaves in seemingly rational ways. However, what appears safe at the moment may prove to be fairly irrational in hindsight. If you find yourself struggling to make sense of things at the moment or want to jumpstart a plan to build your long-term financial wealth, please reach out.
Bill


